Insights and Commentaries
CCS Policy Indicator updated for 2015
15th September 2015
Topic(s): Carbon capture, Carbon markets, Domestic policy, Health, law and regulation, Policy, Public engagement, safety and environment, use and storage (CCUS)
The Global CCS Institute's Policy Indicator (CCS-PI) is an assessment of policy support for carbon capture and storage within countries with most promising conditions for its deployment. The 2015 update to the Institute's policy indicator has just been released, providing new information since its first publication in 2013. In this Insight, the Institute's Lawrence Irlam, Senior Advisor Policy and Economics, Asia Pacific, region introduces the CCS-PI and some of the major changes since 2013.
In 2013 the Institute first published its CCS Policy Indicator (CCS-PI), which ranks various countries in terms of their policy support for carbon capture and storage (CCS), relative to the level of interest they should have in the technology. The Institute has recently updated this CCS-PI for 2015. The results of the CCS-PI are presented as a matrix with the two leading indices making up the X (Constituent Policy Index) and Y (Inherent CCS Interest) axes (see figure 1). A full explanation of the CCS-PI and the 2015 results is found here.
Figure 1: 2015 CCS Policy Indicator results
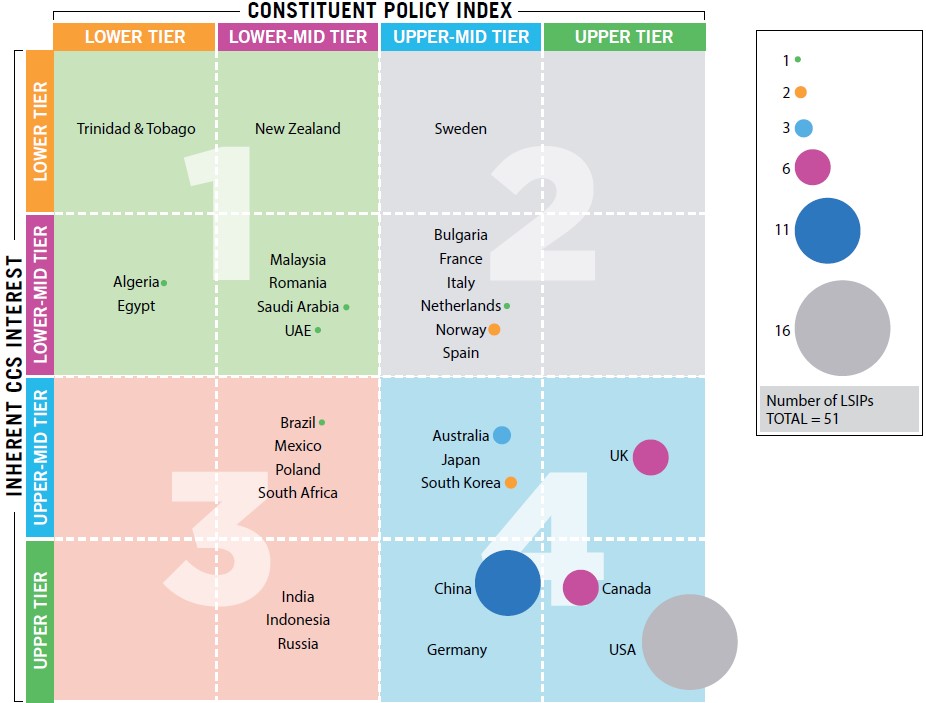
Key findings for the 2015 CCS-PI are:
- The United Kingdom (UK) continues to be the highest ranking country in terms of policy support for CCS, with a variety of market based incentives, regulation and direct funding
- Canada and the United States (US) also have a supportive policy environment and have moved into the “upper tier” of Constituent Policy rankings since 2013, in part reflecting developments on emissions performance standards and related regulations
- As the Policy Indicator reflects relative degrees of policy support, recent progress in Canada and the US has resulted in Norway being pushed into the ‘upper-mid-tier’ category of the Policy Index dimension, in spite of it having strong market incentives and other policies supportive of CCS
- While China has remained in the ‘upper-mid tier’ ranking on the Constituent Policy index, it has implemented a range of supporting policies since 2013 and its progress is consistent with its ‘upper tier’ ranking in Inherent CCS Interest.
Canada, China, Germany, India, Indonesia, Russia and the US all share upper-tier rankings for Inherent CCS Interest, which reflects fossil fuel production and consumption, and associated carbon dioxide (CO2) emissions. In 2014 these countries made up 76% of global coal consumption and 33% of global natural gas production, which weigh heavily in the Inherent CCS Interest index. Within this group, India, Russia and Indonesia would benefit with stronger policy support. The UK, Australia and Japan are the highest ranking countries in the ‘upper-mid tier’ cohort for Inherent CCS Interest. Japan is one of the world’s largest consumers of fossil fuels, Australia is a large producer and consumer of coal, and the UK has moderate levels of production and consumption across all fossil fuel types.
The Constituent Policy Index combines policies that are weighted to reflect their importance in the development and large-scale deployment of CCS technologies. Policies can be specific to CCS, (typically grant funding, roadmaps and institutions established to encourage knowledge sharing) or generally encouraging of all emissions reduction technologies (including prices on carbon). The top five countries in terms of the Constituent Policy Index are the UK, US, Canada, Norway and the Netherlands.
Key policies implemented by these countries include:
- Power sector emissions performance standards or age restrictions (UK, Canada and proposed in the US)
- Carbon taxes and emissions trading (Norway, UK and Netherlands)
- Large scale project and R&D funding
- Supportive legal and regulatory frameworks
- Tax credits (US)
- Power purchase arrangements
- Other market incentives (eg the UK’s contracts for difference)
Different policies will be more or less important depending on the state of technology in particular applications (see Figure 2), as well as local economic and technical factors. For example, the technology used in CO2 separation and capture in natural gas processing has been used at commercial scale for decades, where wide-scale deployment is possible with suitable market based incentives. The Sleipner gas processing project was developed in direct response to Norway’s carbon tax and commenced operation almost 20 years ago. In other applications, government support in research and development has been necessary to prove capture and injection technologies at demonstration scale, with efforts now focused on reducing costs and risks at larger scale. As a result of the investment in research and development, the world’s first large-scale CCS project in iron and steel production will commence operation in Abu Dhabi next year, while first-of-a-kind projects in power generation are also appearing in Canada and the US. Projects like Petra Nova and Kemper County, in addition to Boundary Dam, have been made possible by direct public subsidies designed to overcome the risks typically associated with first mover projects in any type of technology, as well as operational support from power purchase arrangements and enhanced oil recovery (EOR) revenues. From a policy standpoint, the sale price of CO2 under EOR arrangements provide an indication of what carbon price would be sufficient to incentivise CCS projects.
Figure 2: Policy and technology phases
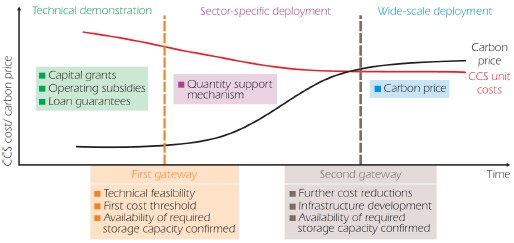
Source: IEA, A Policy Strategy for Carbon Capture and Storage, January 2012.
As is the case with all emission reduction technologies, significant policy support is required to deploy CCS at a scale that is commensurate with the level of emission reductions required under a 2 degrees scenario. The CCS-PI is a useful tool for the Institute in examining the extent to which governments are providing such support, as well as addressing the issue of ‘policy parity’ where CCS is put on equal footing with other low and zero emission technologies.
As at August 2015, there are 51 large-scale integrated CCS projects around the world in operation or in various stages of planning, with investment in CCS totalling around US$13 billion since 2007. While encouraging, this compares to investment in renewables power generation technologies (predominantly wind and solar PV) of around US$1,800B over the same timeframe. The large-scale CCS projects in operation around the world today can capture around 27 million tonnes of CO2 per year. Under the IEA’s modelling of least cost technology pathways, this would need to increase to 6,460 million tonnes per year by 2050 if the world is to achieve emissions reductions that will likely limit global temperature rises to within 2 degrees Celsius.